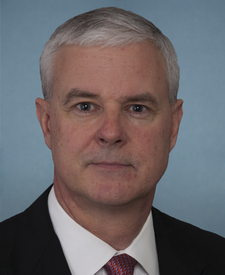
U.S. House · Arkansas, District 3
Rep. Steve Womack
Where they sit
Seated by voting record in the House. Percentiles run from 0 (most liberal) to 100 (most conservative).
Steve Womack's seat is marked. Seats run from most liberal (left) to most conservative (right). Color shows how often each member crosses party lines toward the middle on votes that divide the parties: solid blue or red means almost never, and purple means on at least 1 in 10 of those votes. Gray seats are members too new to score. How this is measured
This score measures who votes with whom. A member who votes no because a bill goes too far, or not far enough, can look more moderate than their views.
With their party and with the President
How this is measured →Lower than 187 of 219 House Republicans.
Expected is the typical score for members of the same party whose districts voted like this one for president in 2024.
Each line is one House member, grouped by party. The dot is Steve Womack. The dark line is what we'd expect given how this district voted for president in 2024.
How this is measuredLower than 186 of 219 House Republicans.
Expected is the typical score for members of the same party whose districts voted like this one for president in 2024.
Each line is one House member, grouped by party. The dot is Steve Womack. The dark line is what we'd expect given how this district voted for president in 2024.
How this is measuredWhere they broke ranks
Votes where Steve Womack went against most of their party or against the President's stated position.
-
July 15, 2026
H605Voted No -
July 15, 2026
H602Voted No -
July 14, 2026
H598Voted No -
May 13, 2026
H524Voted No -
Feb. 24, 2026
H432Voted Yes -
Jan. 22, 2026
H404Voted No -
Jan. 22, 2026
H403Voted No -
Jan. 14, 2026
H387Voted No -
Jan. 14, 2026
H386Voted No -
Jan. 8, 2026
H369Voted Yes -
Jan. 8, 2026
H368Voted Yes -
Sept. 4, 2025
H235Voted No -
Sept. 4, 2025
H234Voted No -
Sept. 3, 2025
H233Voted No -
Sept. 3, 2025
H232Voted No -
Sept. 3, 2025
H231Voted No -
Sept. 3, 2025
H230Voted No -
Sept. 3, 2025
H229Voted No -
Sept. 3, 2025
H227Voted No
Every vote
Every roll call in the House this Congress, with how Steve Womack voted, how their party voted and the President's position.
| Date | Vote | Their vote | Most of their party | President wanted | Result |
|---|---|---|---|---|---|
| Loading… | |||||
A dash means the parties didn't split on that vote, or the President took no public position before it. “Party-line” and “President took a position” list exactly the votes each score counts: the ones cast Yes or No. Missed votes don't count either way and are under “Missed”.
Votes most like
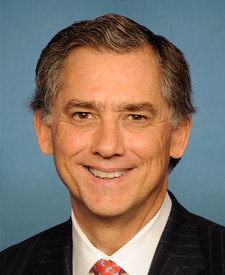 Rep. J. French Hill
Voted the same way 100% of the time
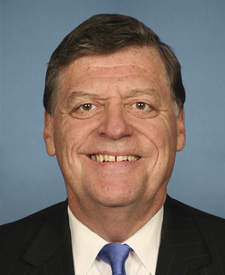 Rep. Tom Cole
Voted the same way 99% of the time
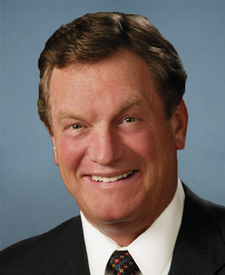 Rep. Michael K. Simpson
Voted the same way 99% of the time
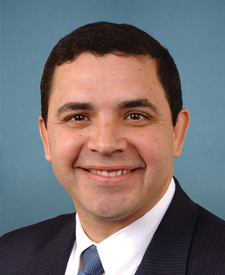 Rep. Henry Cuellar
Closest member of the other party · Voted the same way 56% of the time
Your district
Arkansas's delegation →How this district voted for president in 2024
Arkansas's district lines are not changing for the next Congress.
Contact
- Phone
- 202-225-4301
- Office
- 2412 Rayburn House Office Building Washington DC 20515-0403
Issue by issue
How often Steve Womack votes with their party, and with the President, on each kind of issue. Issues are the policy areas Congress assigns to each bill. "With their party" counts only votes where most Democrats and most Republicans voted on opposite sides; "With the President" counts only votes where he took a public position first.
Steve Womack sides with their party least often on Economics and Public Finance (78%).
Fewer than 5 party-line votes, so not charted: Animals (3 votes), Taxation (3 votes), Health (3 votes), Transportation and Public Works (2 votes), Arts, Culture, Religion (2 votes), Civil Rights and Liberties, Minority Issues (2 votes), Families (2 votes), Science, Technology, Communications (1 vote), Native Americans (1 vote), Social Welfare (1 vote), Water Resources Development (1 vote), Emergency Management (1 vote), Sports and Recreation (1 vote).
Steve Womack votes with the President about equally often on every issue.
Fewer than 5 votes where the President took a position, so not charted: Armed Forces and National Security (3 votes), Education (3 votes), Law (3 votes), Commerce (2 votes), Animals (2 votes), Science, Technology, Communications (2 votes), Congress (1 vote), Labor and Employment (1 vote), Agriculture and Food (1 vote), Taxation (1 vote), Transportation and Public Works (1 vote), Arts, Culture, Religion (1 vote), Native Americans (1 vote), Social Welfare (1 vote), Water Resources Development (1 vote), Housing and Community Development (1 vote).
Bipartisan bills led
1 passed their chamber · 0 became law
-
H.R. 1107 · Protecting Veteran Access to Telemedicine Services Act of 2025Sponsor · Introduced Feb. 6, 2025 · Armed Forces and National SecurityPassed one chamber
-
H.R. 9452 · Budgeting for a Better America ActSponsor · Introduced June 24, 2026 · Economics and Public FinanceIntroduced
-
H.R. 3028 · Duty Drawback Clarification ActSponsor · Introduced April 24, 2025 · Foreign Trade and International FinanceIntroduced
-
H.R. 2615 · Stephen Hacala Poppy Seed Safety ActSponsor · Introduced April 2, 2025 · HealthIntroduced
-
H.R. 715 · BNA Fairness ActSponsor · Introduced Jan. 23, 2025 · TaxationIntroduced
-
H.R. 597 · PURR Act of 2025Sponsor · Introduced Jan. 21, 2025 · Agriculture and FoodIntroduced
-
H.R. 222 · Sustainable Budget Act of 2025Co-lead · Introduced Jan. 7, 2025 · Economics and Public FinanceIntroduced
Votes: Voteview (UCLA). Bills: Congress.gov. President's positions: our public list. 2024 results by district: The Downballot. How this is measured · Corrections